7. Stats
This tab serves as your central hub for tracking AI interactions on your WordPress site, providing insight into your API usage and offering a transparent view of associated AI costs. The interface is divided into two main sections: the table and the chart. You can easily toggle between them. Below is a detailed breakdown of each.
7.1 Filtering stats

Filters options:
- DATE: This is when the AI activity occurred.
- MODULE: This is in what module the AI Activity occurred. For instance, we want to track the activity in the module playground.
- USER: It refers to the ID of the user who is currently logged into the admin panel when the API query is made. In summary, the User ID logged into the admin panel is indeed the same ID as the post editor when they make changes to a post.
- ROLE: In WordPress, users have different roles (like editor, contributor, or administrator). This tells you the role of the person who made the AI request.
- API SERVICE: This is the name of the AI service being used. There are different AI “brands” or services.
- API TYPE: This lets you know the type of task the AI performed.
- Completions: Activities where the AI completes content or actions.
- Chat: Interactions that involve conversational AI tasks.
- Edit: Tasks where the AI edits or refines content.
- API MODEL: This is the specific model or version of the AI being used.
Actions:
- RESET: Restore default settings.
- FILTER: Save filter preferences.
7.1.1 Tokens and Cost
Additionally, we offer filtering options based on tokens and cost.
- Input Tokens & Output Tokens: Tokens are tiny pieces of information the AI uses to understand and generate content. “Input Tokens” are pieces of information given to the AI, and “Output Tokens” are pieces of information the AI provides back. Think of it as words in a conversation: “Input Tokens” are words you say to the AI, and “Output Tokens” are words the AI replies with.
- Total Tokens: This is simply adding the Input and Output Tokens together. It’s the total number of “words” in your conversation with the AI.
- Input Cost, Output Cost & Total Cost: These sections tell you the cost associated with each AI activity. Just like making a phone call might have a cost per minute, using the AI has a cost associated with each task. “Input Cost” is the price of giving information to the AI, “Output Cost” is the price of receiving information from the AI, and “Total Cost” is the combined cost of both.
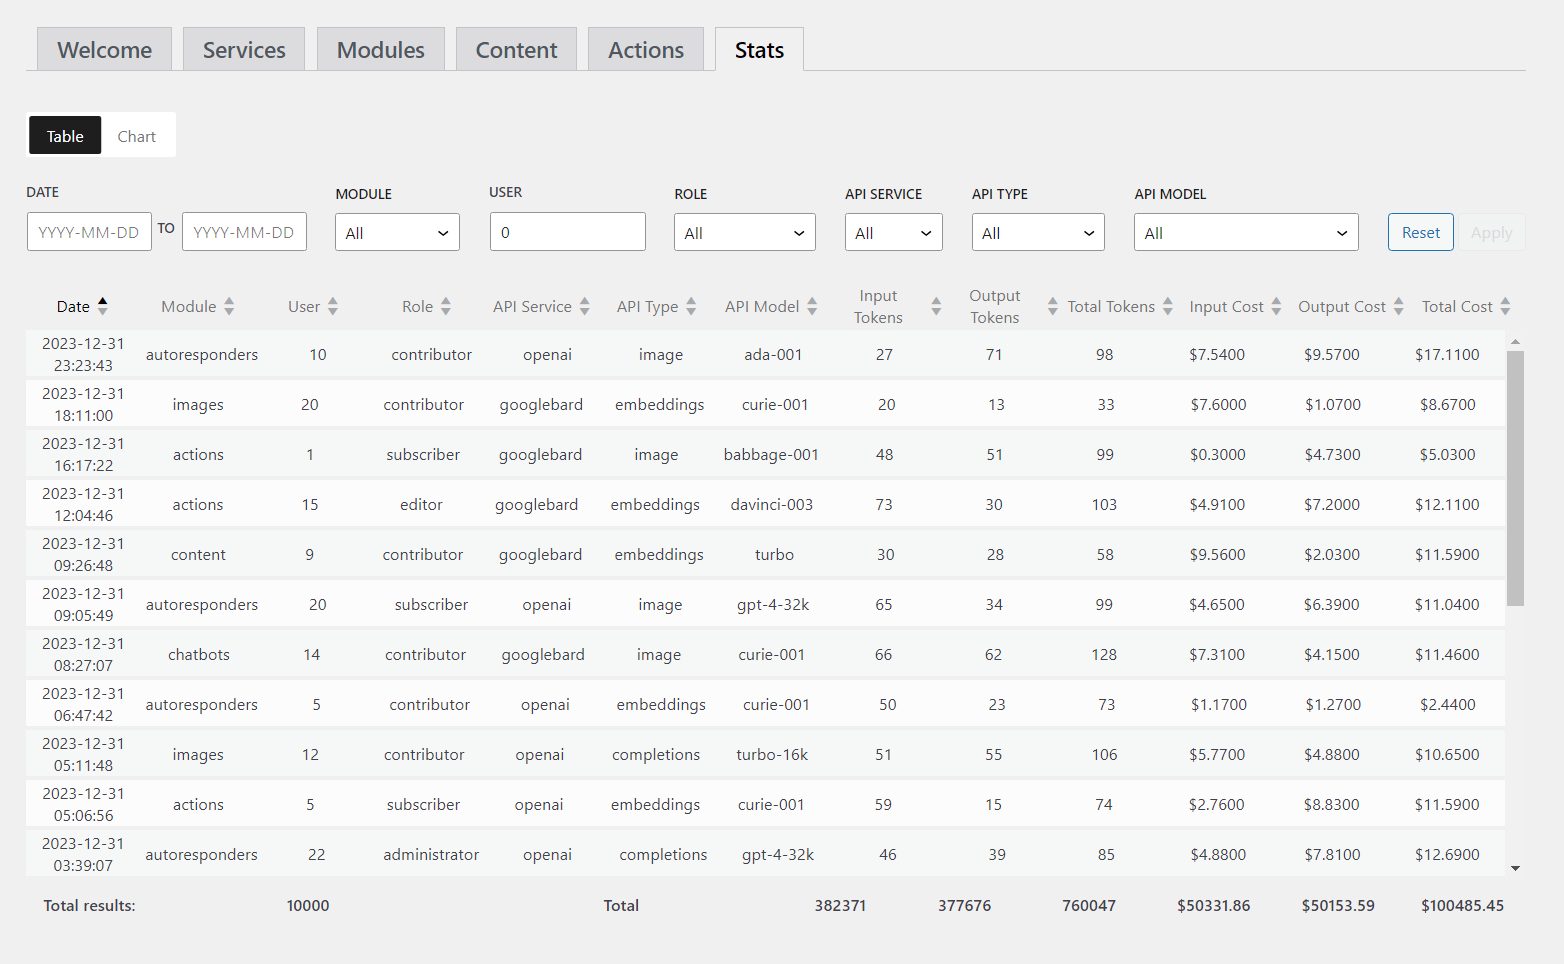
TABLE:

CHART:

7.2 Table
This table provides insights into API usage, detailing token counts and associated costs. Each row presents comprehensive information ranging from the date, the specific API service, the user ID that accessed the API, to the precise token counts and their corresponding prices, and more.
At the table's conclusion, you'll find an aggregated summary of all the statistics.
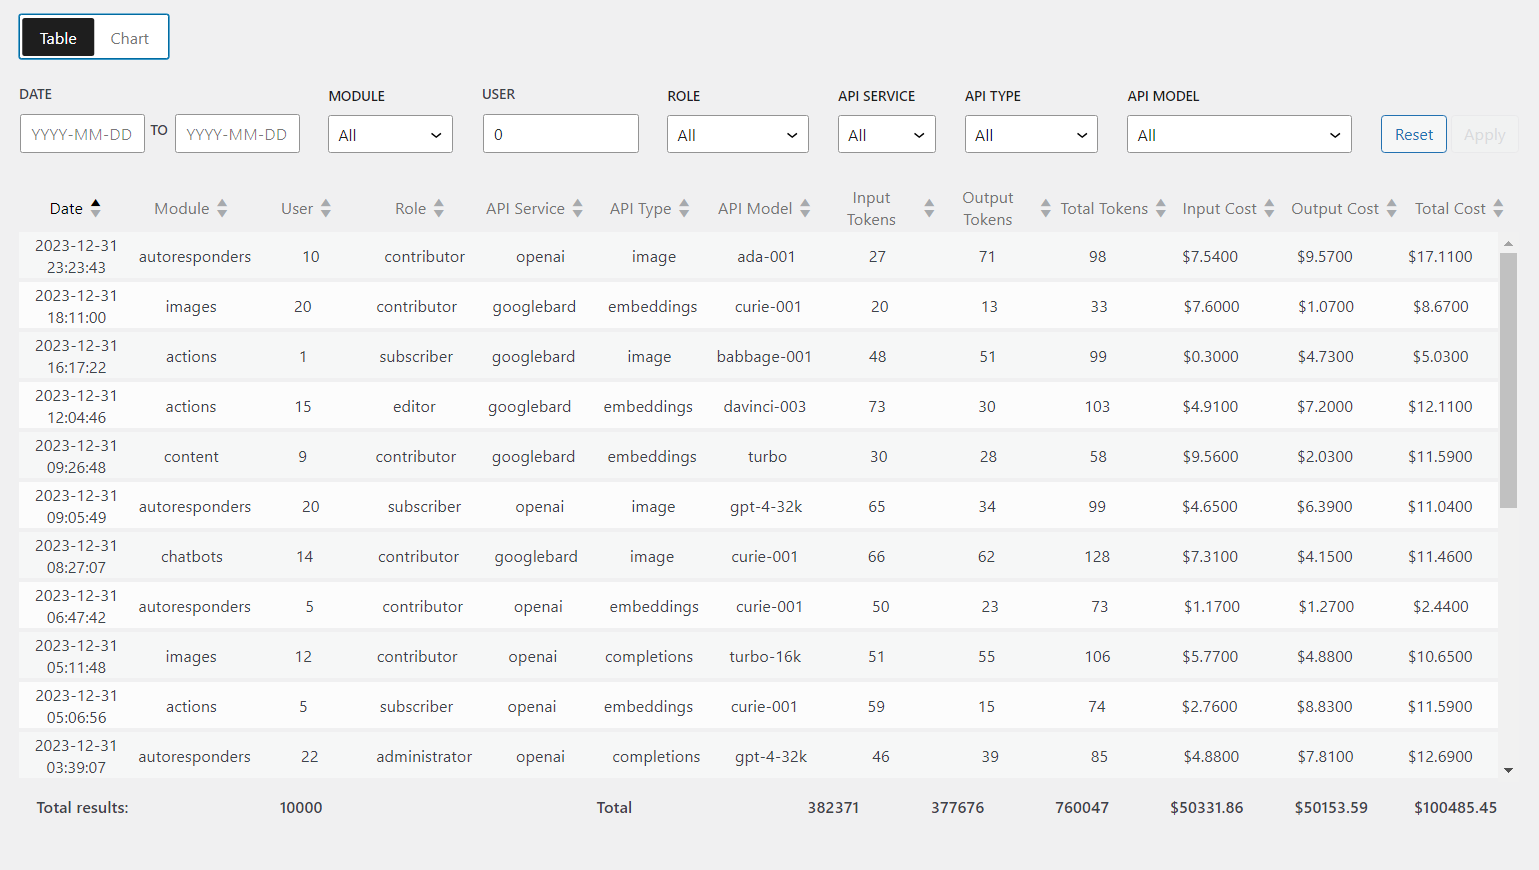
Compared to the chart version, this table may offer a clearer reading experience and can accommodate more detailed information.
7.3 Chart
This chart provides a visual representation of API usage over time, specifically focusing on token costs and usage.
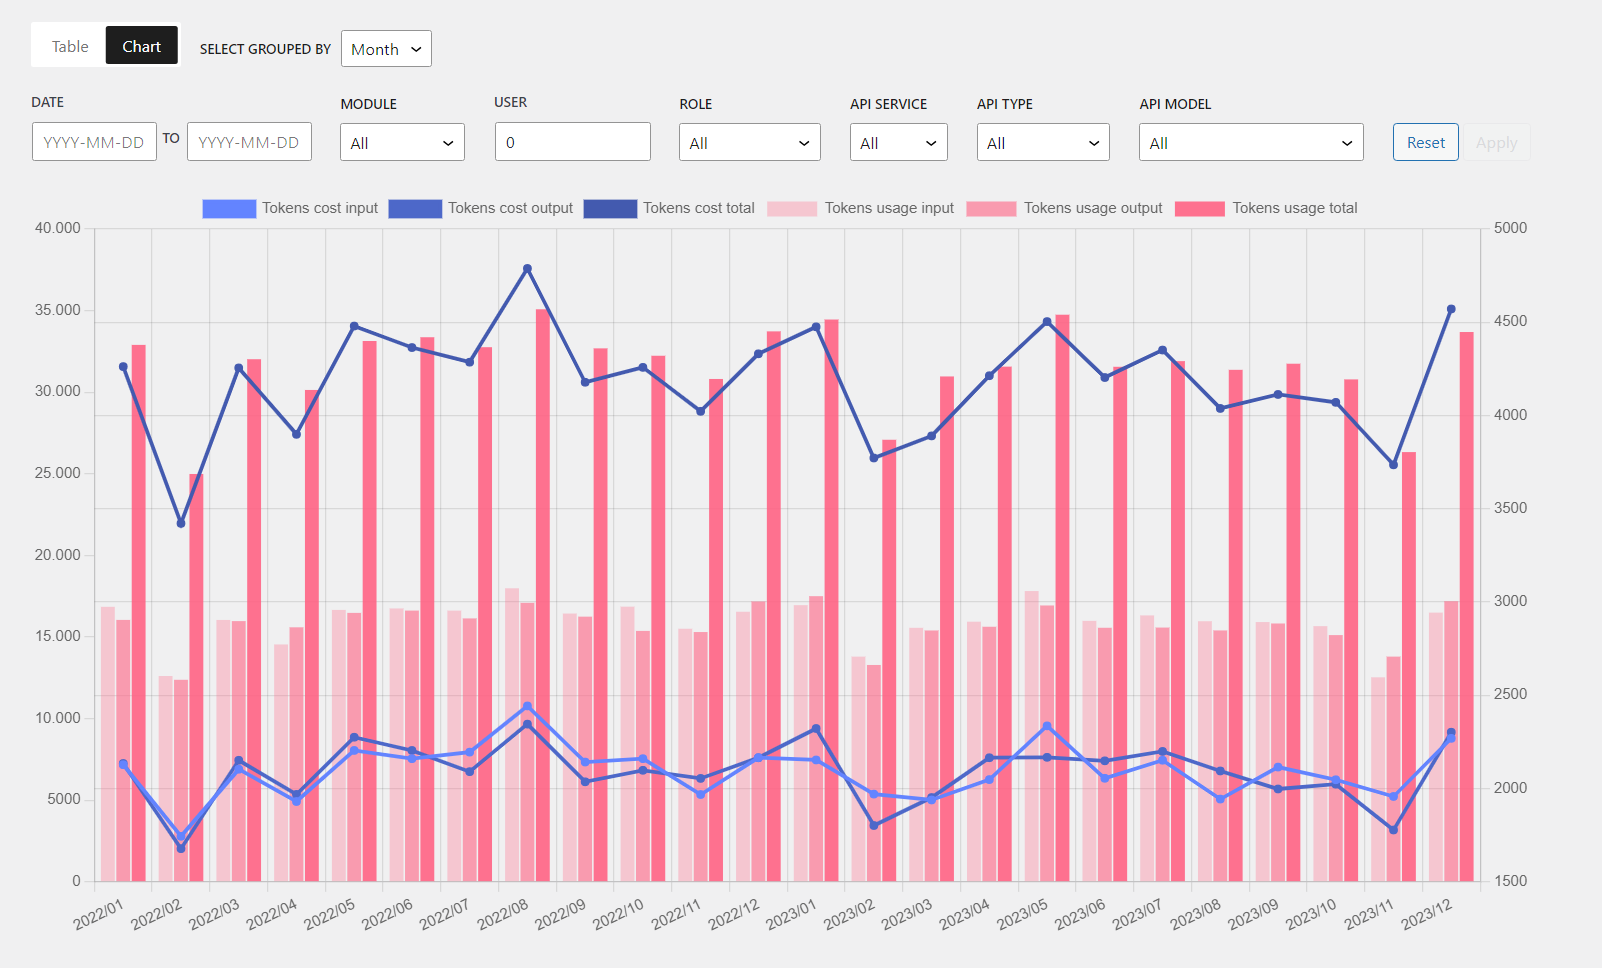
Moreover, an additional filter allows users to group the data by day, month, or year. This feature offers a more granular or broad view, depending on the preferred time grouping, enabling users to identify daily variations, monthly trends, or yearly overviews.
In essence, the chart offers a comprehensive view of token-related costs and usage over a three-year span, with the flexibility to focus on specific parameters through filtering.
